
F1 and F2 are generation labels that trace offspring from a particular cross. F1 is the first generation produced by that cross. The offspring of F1 plants are usually called F2 when the F1 plants self-pollinate or cross with other F1 plants from the same original cross. The labels tell you where a plant sits in a breeding lineage. They are not grades for seed quality, germination, or growing season.
The F stands for filial, meaning offspring. The parent generation is often labeled P, for parental. For a broader introduction to how parent plants, hybrids, and traits relate, see Parent Plants, Hybrids, and Traits: How Are They Connected?.
What does F1 mean on a seed packet?
On garden seed packets, F1 hybrid usually means the seed came from the first generation of a cross between genetically different selected parent lines. When that seed germinates, the plant is still an F1 plant from the same cross.
“F1” and “F1 hybrid” describe related but different things. F1 identifies the generation in a particular cross. Hybrid describes offspring produced from genetically different parents. The label does not mean that F1 is a stage in a plant’s growth.
F1 also depends on the cross being tracked. If an F1 plant self-pollinates, or if it is crossed with another F1 plant from the same original cross, the resulting offspring are F2. If it is crossed with a plant from another line, the offspring belong to that new cross; they are not called F2 just because one parent was F1.
For the difference between self-pollination and pollination between plants, see Self-Pollination vs. Cross-Pollination: What Is the Difference?.
Why can F1 plants be similar while F2 plants differ?
Many F1 hybrids are produced by crossing parent lines with relatively consistent genetic makeup. If each parent carries a fixed version of a gene, every F1 offspring can inherit the same pair of versions at that location. As a result, the F1 plants may be similar to one another at that gene location.
An F1 plant can still be heterozygous: it has two different versions of a gene at a particular location. That does not conflict with an F1 group being consistent. “Heterozygous” describes one plant at one gene location; group consistency describes how similar the plants are to one another.
If a parent carries more than one version at a gene location, or a seed lot includes several different parent crosses, the F1 offspring may vary too. The F1 label by itself does not guarantee that every plant will look the same.
In a simplified sexual-reproduction model where an F1 plant can produce offspring by self-pollination, the two alleles at a gene location separate during meiosis as pollen and ovules form. Fertilization brings alleles together again. This can give F2 offspring different gene combinations, so some may resemble either parent while others show a different combination of traits. The amount of variation depends on the parents and the traits involved. What you observe can also be affected by growing conditions.
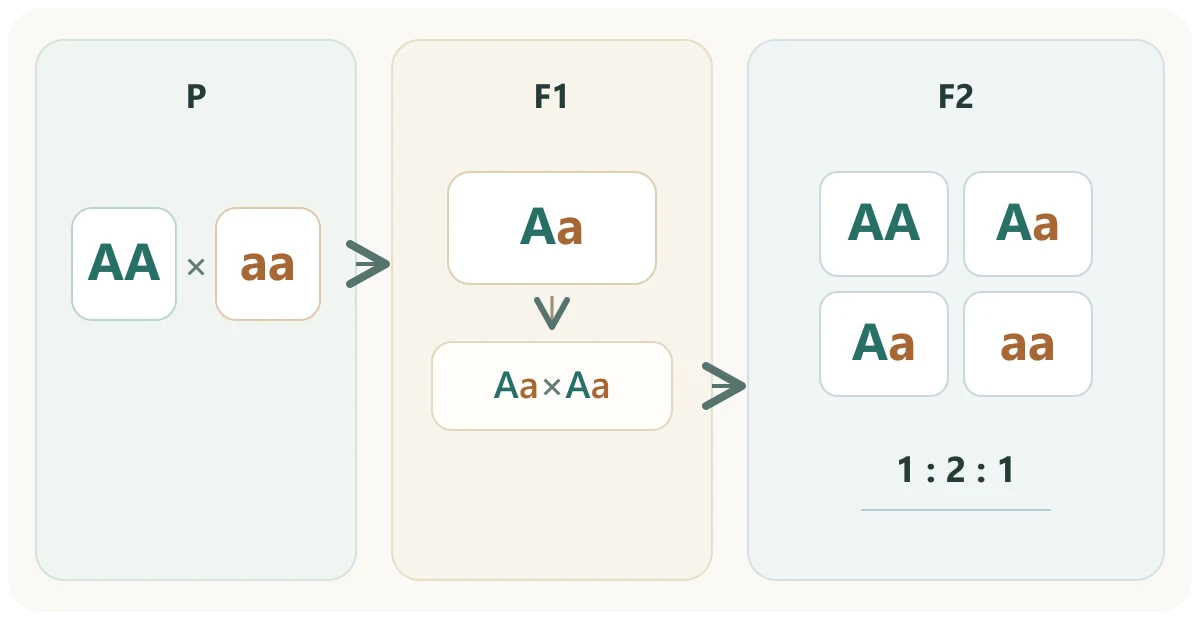
The diagram shows one simplified case. In a diploid model with one nuclear gene locus, if the parents are homozygous AA × aa, every F1 offspring is Aa. When an Aa F1 plant self-pollinates, the expected F2 genotypes are 1 AA : 2 Aa : 1 aa. This is a probability model for that cross, not a promise that every small group will match the ratio exactly. A 3:1 phenotype ratio applies only under the model’s complete-dominance condition; other inheritance patterns and traits involving multiple genes can produce different outcomes.
From F1 to F2: why do white flowers come back?
Follow one pea flower-color gene as its alleles separate and pair up again by chance.
Gametes are the reproductive cells that join at fertilization, and each carries just one of a plant’s two alleles. The purple-flowered parent carries two A alleles (AA) and the white-flowered parent two a alleles (aa), so one can pass on only A, the other only a.
Reduced motion is on: choosing a step shows its final frame.
About this model and the evidence
This is a one-gene teaching model, not data from a real pea population.
- Pea flower color
Purple versus white flowers was one of the seven trait pairs Mendel compared. True-breeding purple crossed with true-breeding white gave all-purple F1 plants; after F1 plants self-pollinated, F2 came out at about 3 purple : 1 white. Pea petals usually open only after pollination, so selfing F1 is a natural example. Later research identified the A gene, which helps control pigment production in the petals. Most white-flowered pea lines examined carry the same small mutation in A, which stops this control protein from working; it is most likely the one Mendel used. Peas have 7 chromosome pairs; this model follows a single gene.
- How meiosis is drawn
The pair of chromosomes is drawn as single rods, leaving out DNA copying and the two divisions; in an ovule, usually only one of the four cells made by meiosis survives and goes on to form the embryo sac with its egg; inside pollen, it is a sperm cell that actually joins the egg, but the drawing simply says pollen. None of this changes the result: about half of F1 gametes carry A and half carry a. The 2 × 2 grid is known as a Punnett square.
- Sampling
Each plant’s pollen and egg each carry A with a one-in-two chance, drawn at random. Eight and 200 plants are only demonstration sizes. Eight plants land on exactly 6 purple and 2 white only about three times in ten; 200 plants usually come out near 3 : 1 but rarely exactly. The expected ratio describes chance across many offspring.
- Where it applies
The 1 : 2 : 1 and 3 : 1 ratios assume parents that are homozygous at this gene, a single gene, complete dominance, and seeds of every combination surviving equally well. Traits shaped by many genes, incomplete dominance or parents that are not homozygous give other ratios.
Breeders can select among offspring for traits that fit a breeding goal. For a plain-language explanation of how breeding and selection differ, see What Is Plant Breeding? Selection vs. Breeding in Plain Language. The generation label records ancestry; it does not tell you which generation is “better.”
Common points of confusion
- ✕ F1 means higher quality, while F2 means lower quality.
- ✓ F1 and F2 identify generation order in a particular breeding lineage. Traits depend on the parents, inheritance, and growing conditions.
- ✕ Every F1 plant is identical, and every F2 plant must differ from its parents.
- ✓ Genetically consistent parents can produce a relatively consistent F1 group. Whether F2 plants vary depends on which gene versions can separate and recombine.
- ✕ F2 plants always follow a 3:1 appearance ratio.
- ✓ A 3:1 phenotype ratio fits only a simplified one-gene model with complete dominance; it is not a rule for all plants or traits.
Breeding records may also use backcross labels such as BC1 or BC2. For that separate notation, see What Is Backcrossing? Why Do Breeders Cross Offspring Back to a Parent?.
Frequently asked questions
What does “F1 hybrid” mean on a seed packet?
It usually means the seed came from the first generation of a cross between selected parent lines. The label describes the cross; it does not guarantee that every plant will have identical appearance or performance.
Does F1 refer to the seed or the plant?
F1 is a generation label. The seed produced by the parent cross gives rise to an F1 plant. Seeds produced when F1 plants self-pollinate or cross with plants from the same F1 group give rise to F2 plants.
Are all F1 plants uniform?
No. F1 plants may be similar when the parent lines and cross are genetically consistent. If a parent carries variation, or a group contains different parent crosses, the F1 offspring may vary.
Do F2 plants always have a 3:1 phenotype ratio?
No. A 3:1 expectation applies to a simplified case with one gene location, homozygous parents, heterozygous F1 plants, and complete dominance. Traits involving multiple genes or other inheritance patterns can have different outcomes, and a small group does not have to match a theoretical ratio exactly.
Is F2 lower quality than F1?
No. F2 is a generation label, not a quality rating. Some F2 plants may resemble a parent, while others may have different combinations of traits. Whether a plant fits a breeding goal depends on the traits being considered.
Evidence and attribution
Sources and image rights
These sources were used to check the plant-science concepts and gardening context in this article.
View sources and further reading (8)
- iastate.pressbooks.pub — pedigree naming systems and symbols
- open.edu — content section 4.2
- open.edu — content section 4.3
- extension.umaine.edu — 2750e
- openstax.org — 12 1 mendels experiments and the laws of probability
- journals.plos.org — article
- pmc.ncbi.nlm.nih.gov — PMC9534762
- openstax.org — 32 1 reproductive development and structure
Image sources and rights
- Plant Note project-made image · Created by Plant Note; no third-party image license applies — The project-made SVG was adapted as WebP for delivery.